Introduction
Scarcity makes every allocation a choice about who gets served and who gets disappointed. When 750 units of demand meet 500 units of stock, someone is going to receive less than they ordered, and the order of allocation decides who.
Most systems answer with whoever ordered first, or whoever ordered most. Both are easy to explain and easy to automate, and both can quietly damage your best relationships. Retailers know the stakes: Walmart fines suppliers 3% of cost of goods on orders that miss its on-time-in-full standards, so a short-shipped key account can cost real money.
So the question is: who should get inventory first, and on what basis? This blog shows how priority-based order allocation answers it, and how IBM Sterling Intelligent Promising (SIP) fits alongside Sterling OMS. It’s one of five use cases in our pillar guide to SIP.
What Is Priority-Based Order Allocation?
Priority-based order allocation is a method for dividing limited inventory among competing orders by customer importance and current service level, rather than by order arrival time or order size.
How it differs from conventional allocation
First-come-first-served and largest-order-first both ignore where each customer stands against their service target. Priority-based allocation uses that position to decide who gets stock first.
How service level is measured: ship ratio
To rank customers by how well they’re being served, you need a measure of their service level over time. Ship ratio is units shipped as a share of units ordered or committed, tracked per customer or segment over a period. If a customer ordered 100 units this period and received 82, their ship ratio is 82%.
It differs from the measures you may already track:
- Fill rate is usually measured per order or line, so it can look fine while a customer’s period-to-date position slides.
- OTIF (on-time, in-full) is a pass/fail test on each delivery, so it only flags a problem after a failure.
- Ship ratio is a running position, so it shows who is falling behind before a failure is recorded.
This blog uses ship ratio because it shows how far each customer is from its target.
Static vs. dynamic priority
- Static priority is a fixed ranking: Customer A always comes first.
- Dynamic priority changes as ship ratios move. A customer who has been shorted rises in the queue, and one who has been over-served steps back.
Why it matters
Without it, service targets get missed, key customers get shorted, and planners spend their time reshuffling allocations by hand.
Why Is Priority-Based Allocation Hard to Get Right?
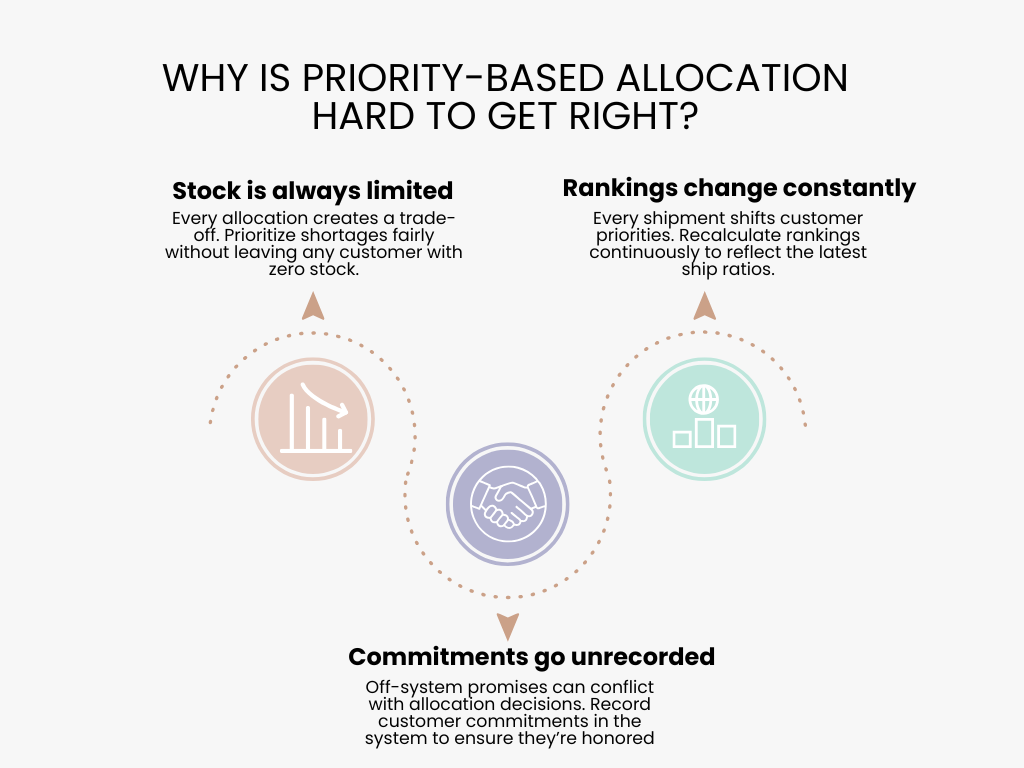
Teams define “priority” differently. Sales ranks by account strategy, finance by revenue, operations by due date. For example, sales wants flagship Customer A first, while operations wants Customer B first because their order is due in two days. Until leadership decides which view wins, there is no rule to automate.
- There is never enough stock. Every allocation creates a loser. The goal is to choose who is shorted deliberately and ensure no customer is cut to zero.
- Rankings go stale. Every shipment changes a customer’s ship ratio, so Monday’s correct ranking can be wrong by Wednesday. Static rankings can’t keep up, and the priority order has to be recalculated continuously.
- Commitments are made outside the system. Account managers promise things like “we’ll protect your January order” that the allocation logic never sees. The result is an allocation that is technically correct but contradicts what the customer was told. These commitments need to be recorded in the system.
Exploring a Real-Life Business Case
Let us consider a case where: there are 500 units available and 750 units of demand from three customers. To keep the arithmetic clear, assume each customer already has 100 units of earlier orders in the current period, and that the projected ratio includes this order (illustrative figures):
| Customer | Tier | Units ordered | Current ship ratio | Target ratio | Due |
|---|---|---|---|---|---|
|
A |
Tier 1 |
300 |
82% |
95% |
3 days |
|
B |
Tier 2 |
250 |
96% |
95% |
2 days |
|
C |
Distributor |
200 |
70% |
90% |
5 days |
A is behind target and strategic. B is ahead of target but due soonest. C is furthest behind, with the longest runway.
Evaluating the Allocation Options
Option 1: First-come-first-served
Orders arrived B, then A, then C. B gets 250 in full, A gets the remaining 250 of 300, and C gets nothing. It’s simple and fully explainable. But C, the customer furthest behind, goes to a projected ratio of 23%.
Option 2: Largest order or highest revenue first
A (300) is served first, then B takes the remaining 200, and C gets nothing again. A reaches its target, but C is again at 23%, and B falls to about 85% on a due-in-two-days order.
Option 3: Tier-based priority
Tier 1 first, then Tier 2, then the distributor. In this case the result is identical to Option 2: A 300, B 200, C 0. That’s telling. Two different rules, one outcome, and both ignore how far each customer is from target.
Option 4: Ship-ratio-gap prioritization with guardrails (preferred path)
Rank by gap to target, then apply guardrails: a floor of 20% of each order, and a cap of 40% of available stock (200 units) on any one customer. C, furthest behind, is served first and reaches its 90% target exactly with 200 units. A is next, up to the cap (200), and B takes the remaining 100.
Outcome table
| Option | A gets (projected ratio) | B gets (projected ratio) | C gets (projected ratio) | Lowest ratio |
|---|---|---|---|---|
|
1. First-come-first-served |
250 (83.0%) |
250 (98.9%) |
0 (23.3%) |
23.3% |
|
2. Largest order first |
300 (95.5%) |
200 (84.6%) |
0 (23.3%) |
23.3% |
|
3. Tier-based |
300 (95.5%) |
200 (84.6%) |
0 (23.3%) |
23.3% |
|
4. Gap + guardrails |
200 (70.5%) |
100 (56.0%) |
200 (90.0%) |
56.0% |
Evaluation matrix
Illustrative scores, 1 (weak) to 5 (strong):
| Criterion | Option 1 | Option 2 | Option 3 | Option 4 |
|---|---|---|---|---|
|
Service-target attainment |
2 |
3 |
3 |
4 |
|
Fairness |
1 |
2 |
2 |
4 |
|
Revenue protection |
3 |
5 |
4 |
4 |
|
Ease of explaining to customers |
5 |
4 |
4 |
3 |
|
Total |
11 |
14 |
13 |
15 |
The takeaway
Each simple option fails one customer in a way that costs more later. Options 1–3 leave C at 23%, and a distributor that far behind escalates, or leaves. Option 4 lifts the lowest ratio to 56% and brings C exactly to its 90% target. It isn’t free: A, the Tier 1 account, drops to 70.5%, and B’s remaining units are first in line when new supply arrives. If A’s contract demands more protection, a protected-account guardrail (see below) raises its floor, and the numbers shift.
Nobody wins everything. The question is whether the losses are chosen or accidental.
How Priority-Based Allocation Works, Step by Step
Step 1: Define priority rules and weights
Agree what “priority” means across sales, finance and operations, and write it down as weighted factors.
Step 2: Build a priority score for each order
A priority score combines several signals into one number. Typical ingredients, with illustrative weights:
- Gap to target (40%): how far behind the customer is
- Customer tier (25%): contractual or strategic importance
- Due date (20%): how soon the order is needed
- Penalty exposure (15%): what a miss costs
Weights are a business decision, not a technical default.
Step 3: Check eligible inventory
Allocate only against stock that’s genuinely free: net of reservations, holds and safety stock. Our post on inventory-aware order allocation covers this step in depth.
Step 4: Allocate in rank order
Work down the ranking, applying floors and caps as you go.
Step 5: Re-rank and reallocate as conditions change
When new supply lands, an order cancels or a ratio moves, run the ranking again.
Full vs. partial allocation
A sub-decision worth making deliberately: do you fill the top order completely, or spread stock to bring several orders closer to target? Filling one order completely is clean and can leave others at zero. Spreading helps more customers a little and may leave none of them satisfied. Guardrails (floors and caps) are how you express the balance you want.
Designing the Guardrails
Guardrails are what keep a good ranking from producing a bad outcome.
- Minimum floors: no customer drops to zero. In our example, 20% of each order.
- Caps: one account can’t absorb all available stock. Here, 40% of supply (200 units).
- Protected accounts or contractual exceptions: some commitments override the score.
- Reallocation triggers: new supply, cancellations or ratio changes prompt a fresh ranking.
- Ownership and review: name who owns the rules, and review them at least quarterly, so priorities follow the business rather than history.
What Are the Business Benefits?
- Service-target attainment: fewer customers stuck far below target
- Fewer escalations and penalties: protecting against the 3%-of-cost-of-goods style of fine
- Transparent decisions: every allocation traceable to a score and a rule
- Less manual reshuffling: planners handle true exceptions, not every shortage
- Stronger key-account relationships: customers see consistent, explainable treatment
The Role of a Modern OMS
Must-haves
Configurable priority rules, order ranking, real-time inventory visibility, reallocation and exception handling. For how this sits within the wider order flow, see our blog on order orchestration vs. order management.
Where IBM Sterling Intelligent Promising fits
Sterling Intelligent Promising’s segmentation allocation plans are the closest built-in mechanism. IBM’s documentation describes ranked rules, an allocation percentage and a minimum quantity per segment, plus a rebalancing frequency. The platform also supports rule-based safety stock. IBM notes the approach minimizes stockout risk on higher-tier segments and rebalances excess from others.
To be precise: ship-ratio scoring is not an out-of-the-box SIP feature. We build it as custom logic around SIP and Sterling OMS, where SIP’s segments carry the floors and percentages.
| Capability needed | Sterling OMS | SIP adds |
|---|---|---|
|
Configurable priority rules |
Sourcing and allocation rules |
Ranked segmentation allocation rules |
|
Order ranking |
Order-level logic |
Segment ranking; custom ship-ratio scoring with Acuver |
|
Real-time inventory visibility |
Order-level view |
Global real-time inventory |
|
Reallocation |
Reservation changes |
Rebalancing frequency; externally triggered allocation |
|
Exception handling |
Order exceptions |
Visibility into why stock was allocated as it was |
How IBM Sterling Intelligent Promising Addresses These Challenges
SIP provides the inventory visibility and segment-level allocation rules, and Sterling OMS executes the orders.
The three-customer case, walked through
- SIP’s inventory view confirms 500 eligible units.
- Ranked rules and minimum quantities set the floors: 60 for A, 50 for B and 40 for C.
- Priority scores, built with Acuver, rank C first on gap, then A, then B.
- Allocation fills in rank order up to the 200-unit cap: C 200, A 200, B 100.
- Sterling OMS takes over execution: reserving the stock, creating the shipments and updating each order. When supply arrives in 3 days, the ranking runs again and B’s remaining units move up.
Getting Priority-Based Order Allocation Right
At Acuver Consulting, we have been IBM Sterling Order Management implementation partners since 2013, working alongside our order management consulting team. Allocation rules are where most of these projects succeed or stall, so we start with the people problems, because no system can fix a rule nobody has agreed on.
We work with your sales, finance and operations leaders to settle what priority means, then turn that agreement into weights and guardrails, such as floors so no customer drops to zero and caps so no one is over-served. Before go-live, we test the result against your order history, so you see the trade-offs before your customers do.
Once the rules are live, our managed services team keeps them tuned as demand and stock patterns change.
Get in touch with our team of experts to understand how we go about it.